Our own Betty Sargeant is a finalist in the Premier’s Design Awards. Congratulations (and a very significant achievement!)
miscellany
2014, Here We Are
Welcome to the 2014 iteration of network media. You’ll find a list of staff and email addresses under the About menu. If you’ve come along here to find out about what’s happening, stay tuned, there will be plenty soon. You will have received an email with details of how to log in to your mediafactory blog. If none of it makes sense don’t panic, just hold on to that email ready for the first classes next week. Any pre class questions, shoot me an email (adrian.miles at rmit.edu.au).
The Monopoly Analogy
I just wanted to post the analogy I used in class to describe the difference between random and scale-free networks. Imagine, if you will, that you need to roll a 12 in a game of Monopoly to get to the ‘Go’ square. If you were using a twelve-sided die, you would have a 1/12 probability of success but because most games use two six-sided die then your probability drops to 1/36 simply because there are more possible outcomes:
For a twelve-sided die:
1|1
2|2
3|3
4|4
5|5
6|6
7|7
8|8
9|9
10|10
11|11
12|12
For two six-sided dice:
2|1-1
3|2-1, 1-2
4|1-3, 3-1, 2-2
5|1-4, 4-1, 2-3, 3-2
6|1-5, 5-1, 2-4, 4-2, 3-3
7|1-6, 6-1, 2-5, 5-2, 3-4, 4-3
8|2-6, 6-2, 3-5, 5-3, 4-4
9|3-6, 6-3, 4-5, 5-4
10|4-6, 6-4, 5-5
11|5-6, 6-5
12|6-6
With the introduction of more elements the bell curve becomes more pronounced. This also represents an interesting feature of random networks. In a random network, a key requirement is that – because they are random – each node is equally probable to connect to any other node. As such, outliers will exist (such as rolling a twelve), though this cannot account for the extraordinary popularity of certain sites. Hubs like Facebook and Google should have an equiprobable chance of appearing as sites with only one or two links. Take the rolls as the number of links to a specific site – if the Internet functioned as a random network you would expect it to represent a bell curve rather than the logarithmic curve described by Barabási.
A scale-free network relies on growth and preferential attachment. We can also use basic probabilities to account for these networks, though we must change the way these probabilities function.
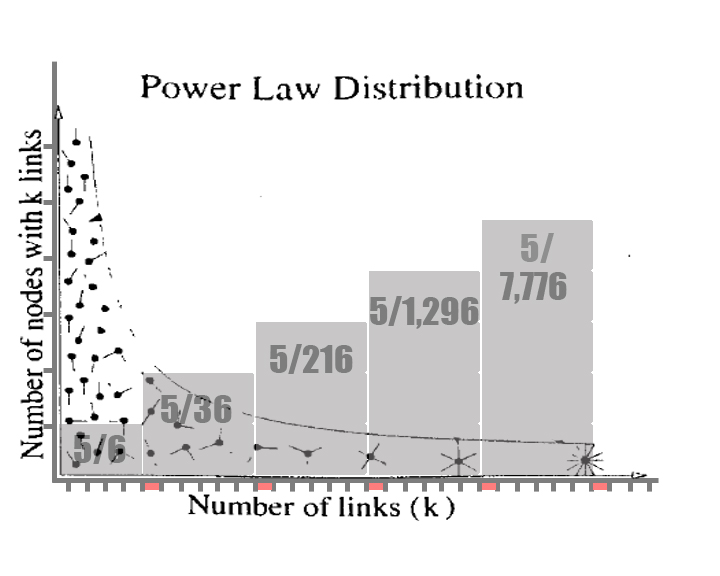
If you roll a double in Monopoly, you get to roll again. Your odds of rolling a double are one in six. It is possible to keep rolling doubles continuously but the probability reduces dramatically every time. (Well, not really. It’s the same each individual time but in terms of the calculated probability of all rolls it reduces exponentially the more you get.) The statistics overlaid on the graph below indicates how many of all possible outcomes exist within each section (ie, 5/6 turns will only receive one roll, 5/36 will have two, etc.)

To demonstrate how this can account for scale-free networks, let’s take a different game of Monopoly. In this game, every time someone lands on your property, you get a chance to roll again, acquiring more property and hence more chances to keep rolling. How many rolls (or links) are you likely to acquire over the course of the game? What if the game had potentially infinite players and potentially infinite squares?
On the Internet, each link to a website increases the exposure of that website and consequently the probability that other users will see and link to it. Of course it does not function as a static, one-in-six probability. There are modifiers based on the perceived value of the content that affect the probabilities of growth. However, you can see how, based on simple probabilities, hubs can emerge naturally simply due to exposure. To illustrate this, I’ve overlaid the graph from above over the power law distribution graph from the Barabási reading:
Welcome to Networked Media Summer Semester
Hello all and welcome to the 2014 Summer semester for Networked Media. By now you should have all received an email to your student account informing you of how to activate your blog, so just follow the instructions and make sure you activate your spam filter!
As a recommended blog post for after this class I would like you to think about the way you organise your own knowledge. How do you learn? How do you make sense of the information you gather? And how is this related to the way in which you “move” through networked environments?
I will be posting the rest of the readings shortly, but for the moment I would like you to read through these before Wednesday’s class. The first is about Chris Argyris’ concept of double-loop learning, a valuable piece in that it makes explicit the ways in which we try to improve upon process (or frequently don’t).
The second is by John Mason on Researching Your Own Practice, and finally we have RMIT’s own Adrian Miles on the use of blogs in media education, a fantastic read for those of you looking to make the most of your blogging experience both now and into the future.
Reflective Graphs
A sharp change in the line generally means a qualitative change in understanding. Not knowing more, knowing different.


Another Lesson from The World
Free OS, another inversion of how we think media industries work. The Age’s (though it comes from Mashable) article does an good job of how disruptive and upside down this is.
Then there is Tile. This is just an elegant, stunning idea about to happen. I would love to teach a studio where we rethink what or how to make a story beginning from a concept like this. One day.
Protocols are Social
Excellent post about Twitter etiquette. These are rules of thumb for all social media. This is what we mean by a social protocol.
Not in Kansas anymore…
Substitute ‘journalism’ for any other heritage media in this story and it is identical. The opening paragraph sums up this subject. The Guardian is doing well in the digital domain and they do not want to employ people who think the digital is just a computer. This subject is network media because digital media is now a tautology. The Guardian is doing well not because they moved to digital, but they moved to the network as a scale free, distributed network. For those of you that have started to get your ‘blogs’ you’re already better equipped for the interview here than the print journalist described. (And read what she writes about the Guardian in Australia and their success because there’s a gap in the market precisely because traditional media here does not understand this new time.)
Culture and Technology and It’s a Mess
Torika wondering what is meant by ‘culture‘ and ‘technology‘. Tony has some observations from the Potts and Murphy and how culture and technology now intertwined. Courtney on technology, culture, and technique.